Tesla crash and burn so frequently in Hong Kong that police call intersections with them tinderboxes.
The company’s vehicles have become such constant fixtures in collision reports that some traffic officers privately refer to certain intersections as “Tesla tinderboxes.”
Notably, other popular brands don’t crash as often as the deadly Tesla, and some not at all, as we know from looking at data.
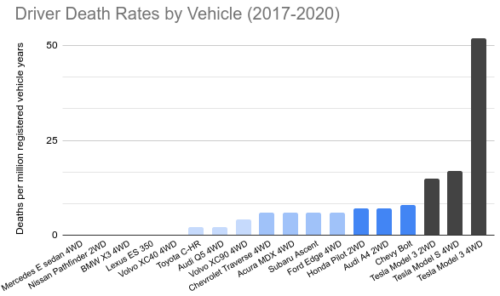
Thanks, Davi, but how can the units on the vertical axis end in “years”. Shouldn’t that be ending in “miles”?
Please fix that. It makes everything look potentially goofed up and questionable.
Thanks,
FL
P.S. Also, if this is based on NHTSA data, then should the title of the plot end in “(2017 – 2022)”? Or did the authors really plot the data only up to 2020, so “(2017-2020)”, as they had it?
@Find Lisa
This graph is accurate as “deaths per million registered vehicle years” is the correct IIHS measurement, not miles. It is a standard metric in traffic safety research that accounts for the number of vehicles registered and the time period they’re on the road; different from “miles traveled” and equally valid for comparing safety outcomes.
What’s alarming is Tesla’s dismal safety record. The Model S 4WD has a death rate over 50 per million registered years – roughly 5-7x higher than comparable luxury vehicles. Even their “safer” models have death rates 3x higher than Mercedes, BMW, or Lexus.
Tesla’s safety claims are fraudulent. The real-world data tells a much different story.